
Detecting Potential Bad Actors in GitHub
The vast open-source software ecosystem contains millions of packages and tens of millions of contributing authors. This is both the strength and the weakness of open-source software: its crowdsourced nature means that packages are continually updated and innovated (for free!), while at the same time leaving them vulnerable to someone slipping in some harmful code. Therefore, to truly detect risk in the open-source software ecosystem, we ought to care about its social components—the behavior and interactions of the many thousands of software authors—as much as we care about its computational components—the code itself.
Here at Phylum, I’m taking on this challenge to find the proverbial malicious needle in the otherwise benign haystack: can we use machine learning to detect unusual behavior among authors of open-source software?
Why should we care about the behavior of code authors, i.e., who contributed code when? And more specifically, why should we care when someone’s behavior appears “unusual”? Well, bad actors might compromise the GitHub or GitLab account of a normal software author to insert malicious code into a package. This way they can quickly slip harmful code into packages anonymously under the borrowed mask of an otherwise upstanding software citizen, lowering the chance of being spotted. This issue extends further to the security model of package maintainers, as they are valuable targets for supply chain attacks.
In this post, we give an overview of a capability to flag potentially anomalous and/or malicious behavior through analysis of commits to a version-control system such as GitHub or GitLab.
Using data to create an understanding of an author’s behavior
GitHub data allows us to get a sense of an author’s code-contributing activity. For example, in Figure 1, we can see that this author has an extremely regular behavioral pattern: they tend to push code at 07:00 or 08:00 UTC daily, a behavioral pattern that held steadily over time, except some commits in late 2017 and early 2018.
Insights like these are key in establishing a baseline understanding of an author’s “regular” behavior. Even though GitHub provides all commit timestamps in the UTC time zone and authors lack concrete geolocation data, we can use the commit behavior data to get a sense of an author’s normal workday. Take me for example: since I’m based on the west coast, most of my work commit activity likely falls between 15:00-24:00 UTC (8am to 5pm local time), with any extracurricular project commits falling in the evening, say 00:00-05:00 UTC (5pm to 10pm local time). Therefore, we can infer my active hours—and perhaps even my time zone—based just on when I’m pushing code.
By understanding what constitutes a normal behavior, we can then better flag commits that are unusual and potentially the work of a compromised account. For example, if my account pushed a commit at 3am PST to a new project that I had never previously worked, it should throw up a big red flag! Similarly, just eyeballing the behavior of the author in the figure below, we might instinctively question the few commits that fall outside of the usual 07:00/08:00 window.
Of course, unusual activity alone may not be a security risk. (Perhaps, I pushed code while on vacation in a different time zone!) But if we can combine evidence from this behavioral analysis with other analyses at Phylum, we can more confidently flag potential security issues. For example, if we find that an author with a lot of sudden unusual behavior also pushed code with potentially malicious elements, we are more certain that this is the work of a bad actor than we would be with either piece of information on its own.
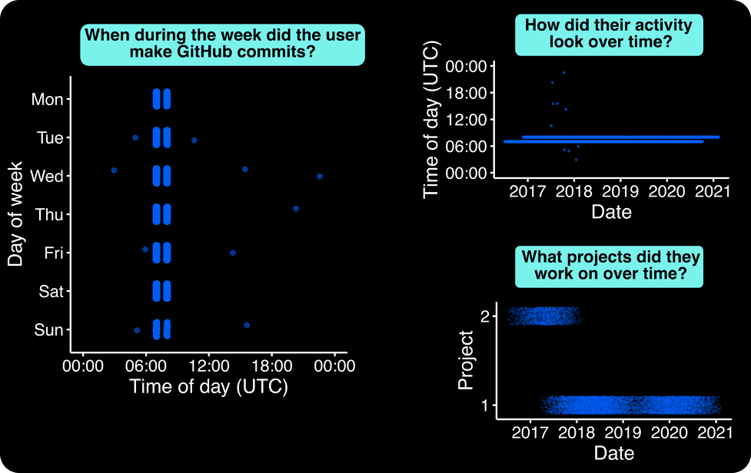
Figure 1 – An example of behavior data we can extract from an author’s Github data. Each panel compares different dimensions of the Github commit data. Each point shown is a commit that the author pushed to a project.
Teaching a machine to find unusual author behavior
While we can certainly manually inspect each author’s behavior and manually flag suspicious commits, we at Phylum are committed to using automatic and rigorous methods to find security issues. So instead, we use machine learning! This allows us to scan the behavior of millions of authors and automatically flag questionable commit behavior.
To find unusual author behavior, we use DBSCAN—a classic unsupervised learning method—to cluster data into “normal” and “unusual” author behavior. Outlined in Figure 2, this method uses the density of data points to determine where clusters are located: points within a certain distance of each other are considered neighbors and part of the same cluster; points without any neighbors are considered outliers. (As an aside, having done a PhD centered on social networks, I really like this clustering algorithm because it essentially constructs a network of data points, finding the cliques and loners among our crowd of data.)
Compared to other clustering methods used, DBSCAN is particularly advantageous in finding outliers in data. For one, it requires fewer parameters to be set ahead of time. Other clustering methods—for example, K-means—require us to set the number of clusters ahead of time, a choice that can drastically affect the model’s performance. Instead, for DBSCAN, we only need to tell the algorithm how close data points need to be to labeled “neighbors” and how many neighbors are needed to be considered part of a cluster. (We can also set these parameters automatically using cutting-edge methods.) Second, DBSCAN naturally marks our loner data points as outliers, since they aren’t assigned to a cluster. Other algorithms require further massaging to detect outliers after clustering.
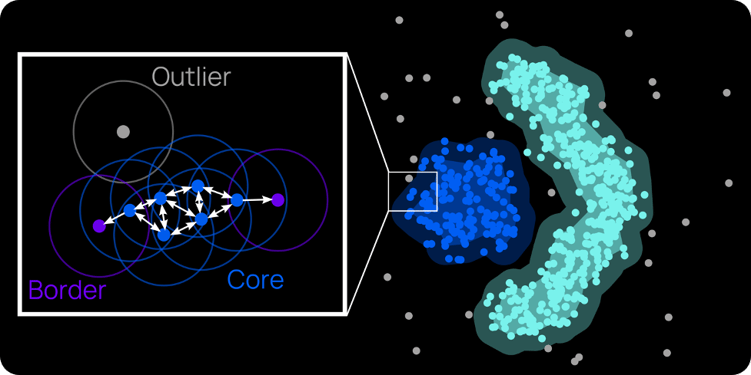
Figure 2 - A visual explanation of DBSCAN, a machine learning clustering algorithm. Points within a certain distance of each other are considered neighbors. Points with enough neighbors are considered a cluster's core. Points with few neighbors mark a cluster’s edge. Points without neighbors are outliers. (Figure adapted from Wikipedia entry on DBSCAN.)
Detecting unusual behavior automatically
Going back to our previous example author: can this unsupervised machine learning approach uncover unusual behavior?
We clean and prepare our data for machine learning, scaling data and turning certain data points (e.g., day of the week) into a quantitative measure that the model can comprehend. We also use an approach that allows us to use both quantitative (e.g., time of day, day of week) and qualitative (e.g., GitHub project ID) data, giving our model more diverse information to learn from!
Fortunately, we can use the exact date (and time) of commits to create a “rolling” sense of normal for each author. We often want to analyze behavior as a time series: people may move locations (and therefore time zones) and shift their behavior due to legitimate reasons. Therefore, using commit date/time in our model ensures that we compare data from the same time period against each other, allowing the model to account for gradual, natural shifts in behavior while still identifying sudden changes in behavior.
Running our model on our example author, we see it picks out anomalous behavior successfully! Looking at Figure 3, we see that the model flags those commits that fell outside the usual 07:00/08:00 pattern. However, we see the model also picked up on some other unusual commits, largely on the weekends.
Thus, we see that the model is going beyond the power of just eye-balling the data and picking up on behavior that would otherwise be hard to spot.
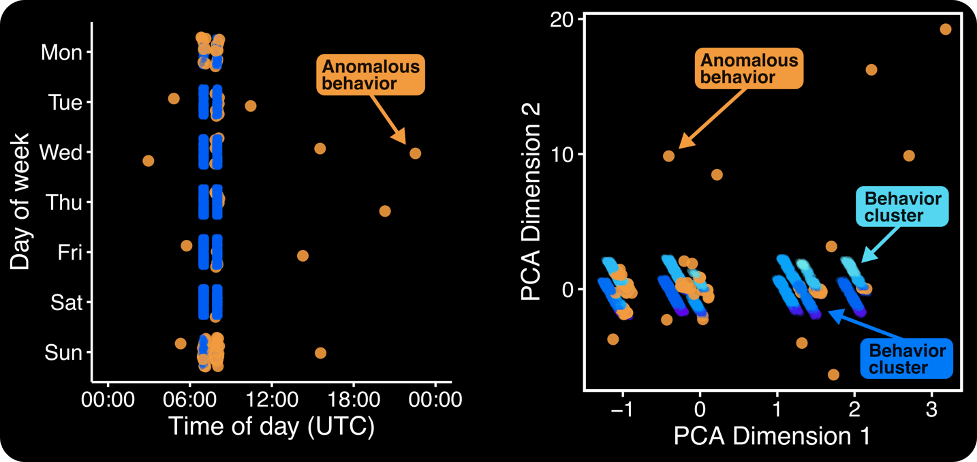
Figure 3 – (Left) Showing the author’s commits across day of week and time of day, with commits that the model thinks are unusual flagged in orange. (Right) Using PCA to project the author’s commit data—which has many features—into a two-dimensional space, allowing us to easily show the data clusters (shades of blue) and outliers (orange).
Detecting risky authors at scale
The model has shown its use at learning the behavior of one author, but what if we run it across thousands or millions of authors at once? Phylum architected the platform to enable this type of analysis, and much more. We use the work outlined in this post to create ML models for each individual author allowing us to learn their specific patterns of behavior. Modern distributed systems really boggle the mind!
Phylum is continually working to improve our author risk analysis to allow users to manage the risk presented by using code written by random strangers on the Internet. The work documented here provides valuable evidence as input into Phylum’s author risk score. This is combined with other analytics, heuristics, and models to continually protect Phylum’s users.
To create this evidence of author risk, we take the findings of our ML model and use a simple logic: a risky author has a relatively high number of commits and a relatively high % of anomalous behavior. Why? Well, an author with few commits provides little evidence to the machine learning model—it’s difficult to build a pattern of behavior out of a few dozen commits, after all. On the other hand, an author with thousands of commits creates a clear pattern of behavior. Therefore, a user with a strong pattern of behavior and a high % of anomalous commits gives us a lot of confidence that something is unusual with their account.
Using this logic, we construct our evidence by multiplying the relative ranks of authors in (a) number of commits and (b) % of their commits that are flagged as anomalous by our ML model. Authors with a high evidence score will be high in both (a) and (b).
As shown in Figure 4, our approach flags a few stand out authors as high risk. These authors have generally pushed many hundreds or thousands of commits, but also have a high number of irregular commits that don’t seem to fit their usual pattern of behavior. For example, some users may do a lot of one-off commits to many different disparate projects, a pattern that doesn’t exactly build confidence.
Combined with other pieces of evidence, this evidence provides input to the author risk score that helps Phylum user’s avoid using packages or versions that are significantly influenced by questionable and/or malicious authors.
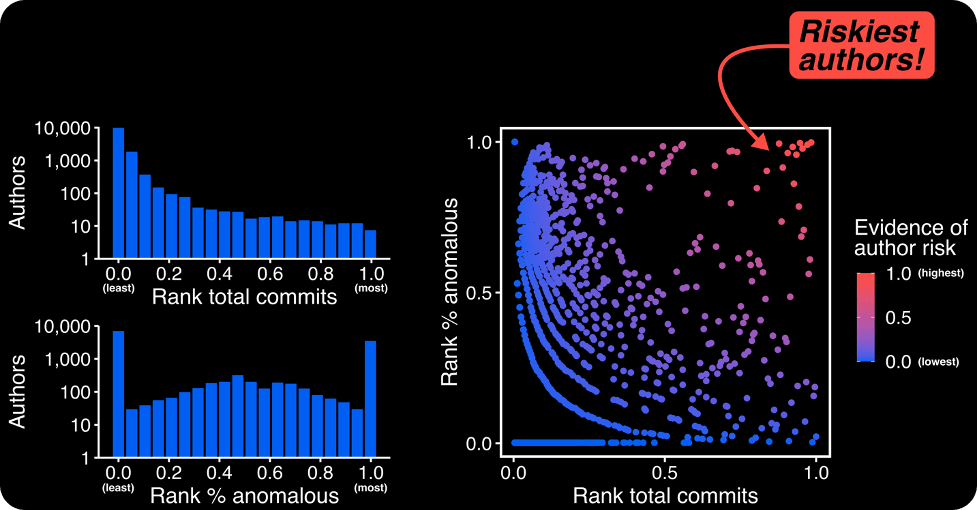
Figure 4 - Our author risk score combines the relative number of commits and the relative % of commits our ML model thinks are unusual. In the end, some authors really stand out from the crowd as potentially risky.
Moving forward
We will continue to iterate and improve this model, first and foremost, by continuing to find and integrate new pieces of data to our model. For example, can we account for the language of a project/commit to find unusual behaviors? I’m usually a Python and R guy, so if you suddenly saw me push a large C++ commit, I’d hope you’d do a double take!
We are working to combine this ML model with our password breach data set, allowing us to ask whether a user’s behavior suddenly become anomalous shortly after one of their online accounts was breached.
Overall, in the Phylum platform, we integrate the output of rigorous analysis like this to create evidence that can be combined to fully capture the degree of risk in the open-source software ecosystem. Be on the lookout for more posts detailing our analytical work!