
The Dependency Network Shows the Complexity of the Software Ecosystem

The open-source software ecosystem as a complex system
It can be complicated to develop software in the open-source software ecosystem. No doubt! But I believe we are increasingly working not just in a complicated line of work, but also within a complex system.
When I say that, I’m not attempting to arbitrarily split hairs between “complicated” and “complex.” In science, a complex system has a precise definition: systems where the collective behavior of their parts entails emergence of properties that can hardly, if not at all, be inferred from properties of the parts. As Aristotle put it “the whole is more than the sum of its parts.” For example, an economy is formed by millions of interacting people and can have dynamics like bull markets and recessions that are hard to predict by looking at any individual consumer. Likewise, an ecosystem is formed by many interacting plant and animal species that collectively have booms and busts; a bee colony is formed by thousands of individual bees who collectively divide up tasks and vote democratically on new hive locations; and a brain is made up of millions of cells that collectively give rise to consciousness.
As you can see, complex systems come in a variety of flavors: social, biological, physical, and even technological. The scientific field that studies these systems—complex systems science, sometimes just shortened to complexity science—also spans scientific disciplines, drawing researchers who study complex systems in the context of their specific discipline: economists (e.g., markets), sociologists (e.g., organizations, social media, cities, and societies), biologists (e.g., the brain), ecologists (e.g., ecosystems and animal societies), physicists (e.g., the universe), computer scientists (e.g., the internet), and mathematicians (the theoretical underpinning for all good complexity science). If you’re really interested in the history of this field, check out the Santa Fe Institute, which is the mecca of complex systems science.
So, turning to the open-source software ecosystem, we see it has many of the distinctive features of a complex system. First, it is a collection of many interacting parts: millions of software packages that link to one another through dependencies, not to mention the many thousands of authors who interact and collaborate to create new packages. Second, it’s highly decentralized, an essential feature of a complex system. Just as there is no central authority in a bee colony that tells each bee which task to work on1, there similarly isn’t a central authority for npm or pypi that tells authors what to work on or which package they should build in as dependencies. Third, many of open-source software’s key features emerge from collections of interacting authors. New and sophisticated packages are produced by teams of distributed authors, the capabilities of a new package are built upon a unique collection of previous packages (i.e., dependencies) and the publishing of a new package can suddenly impact packages many hops down in the dependency graph.
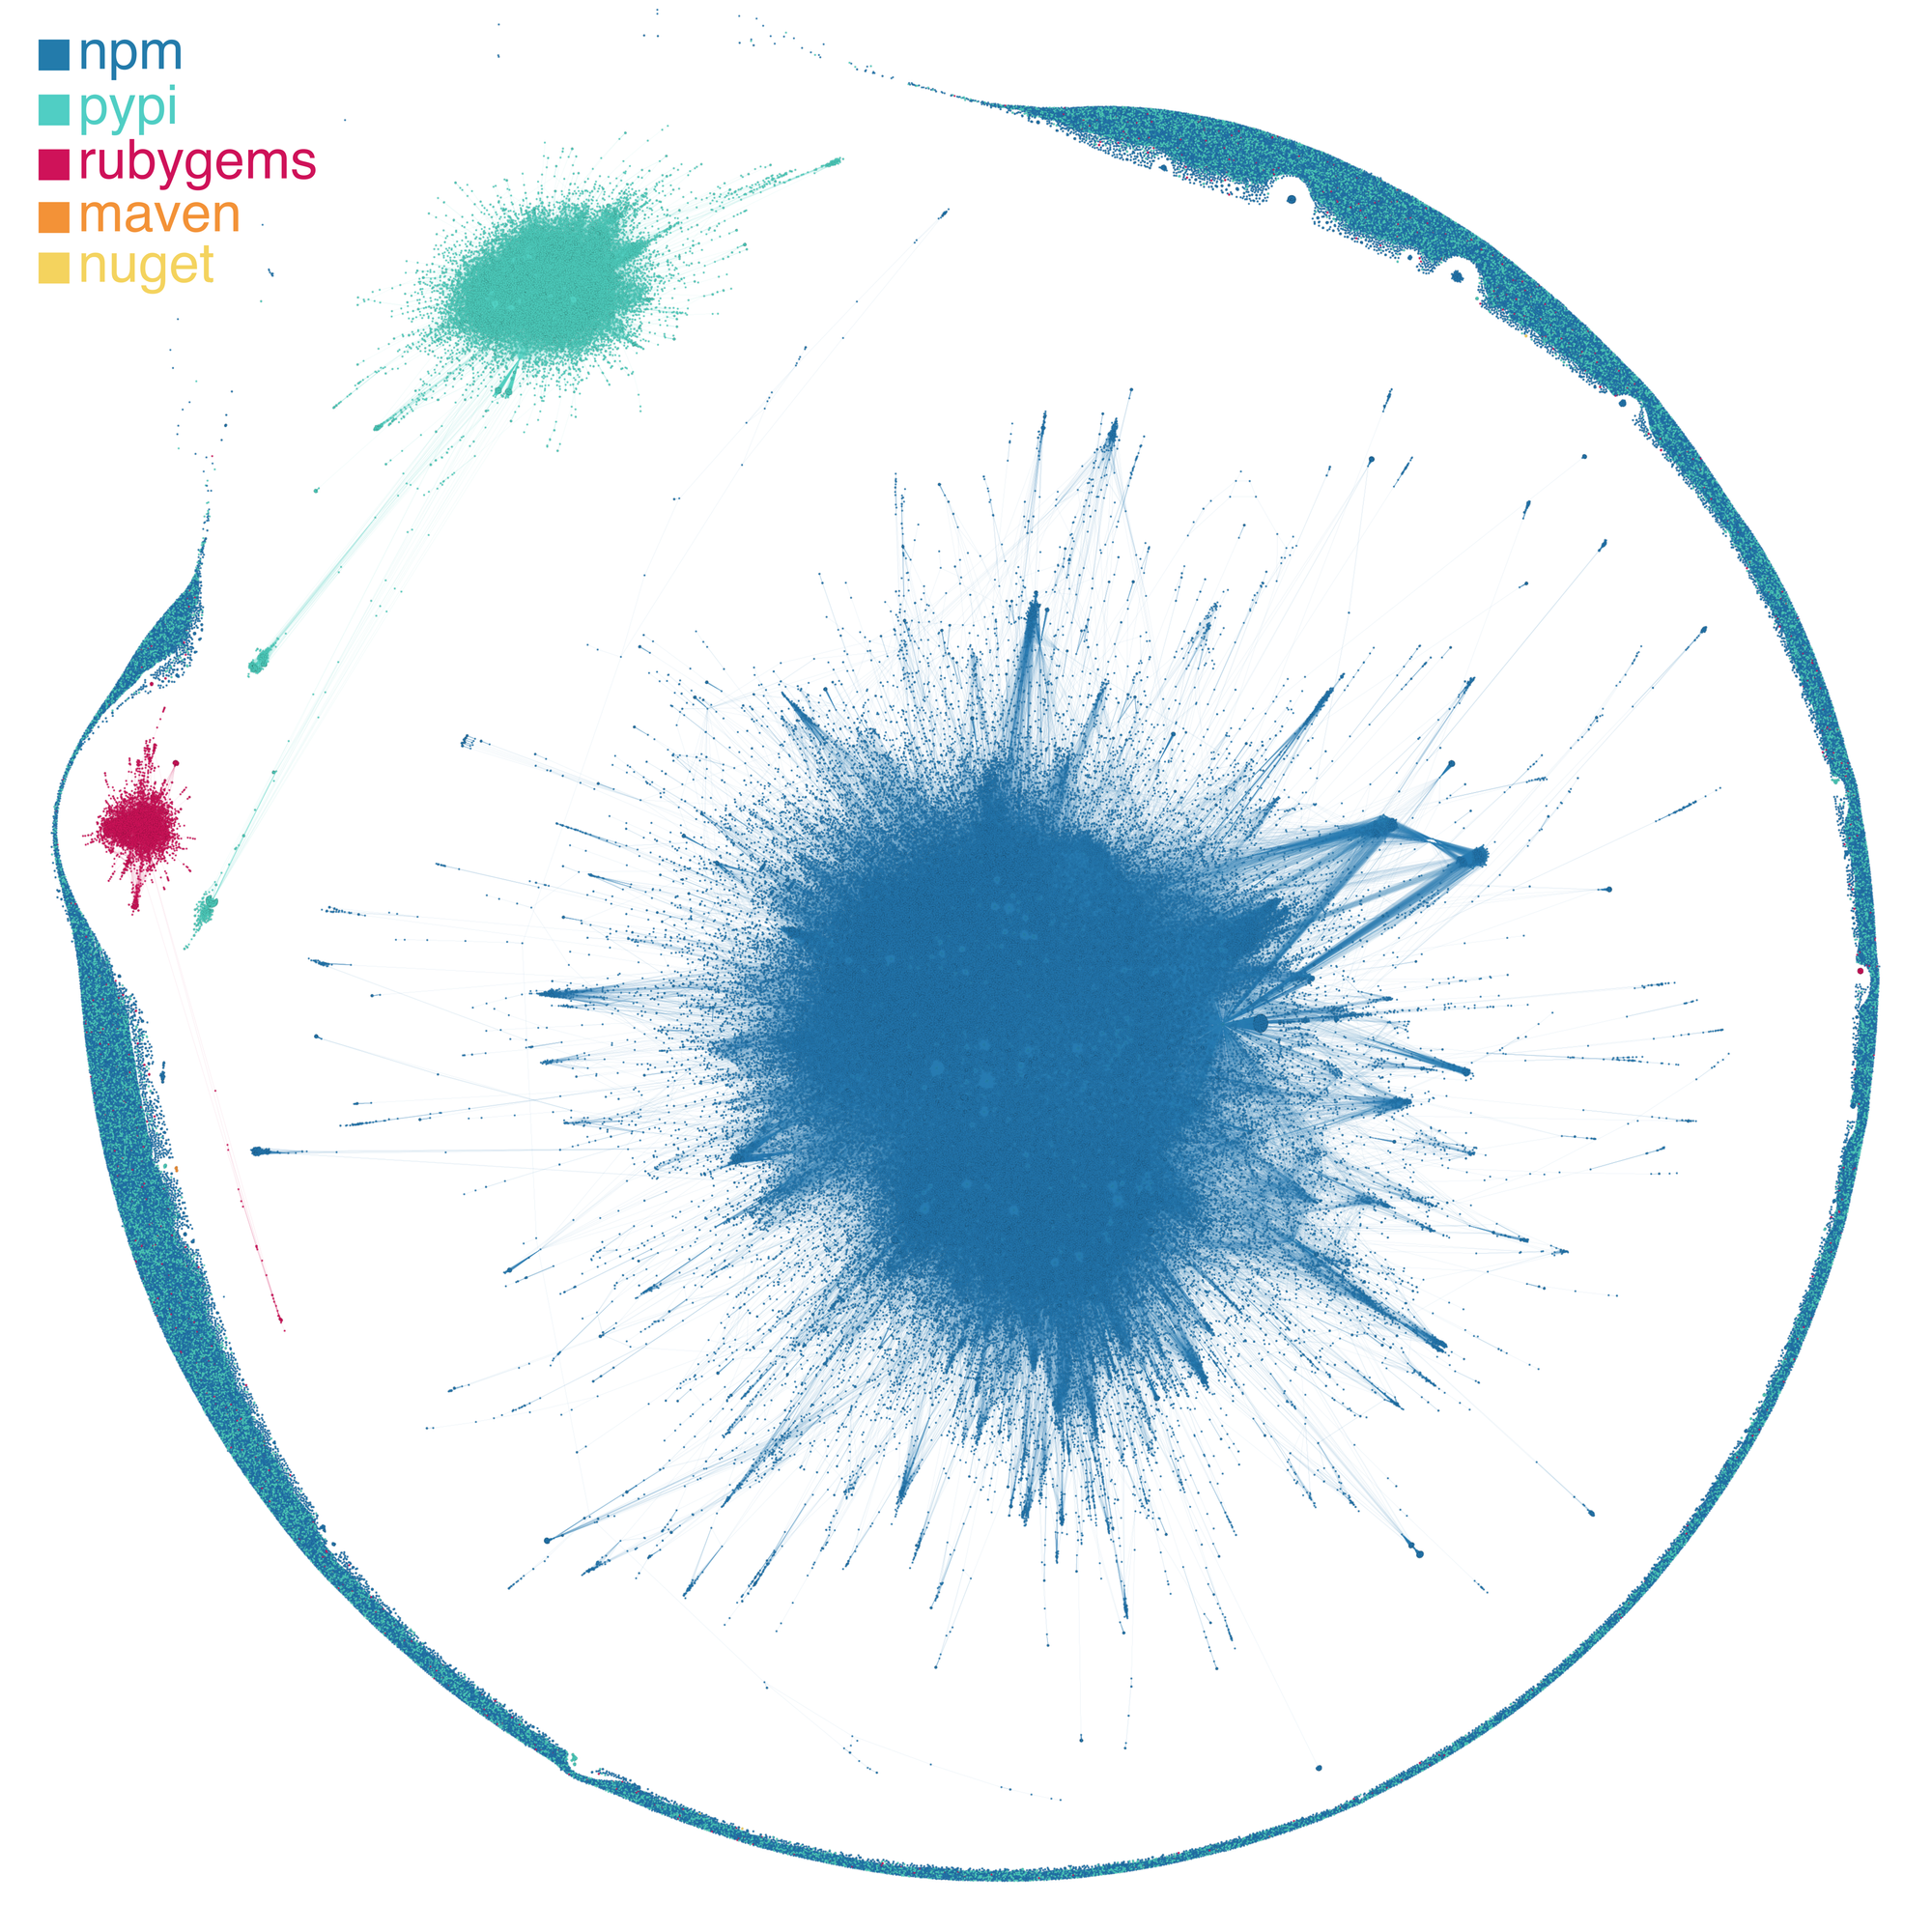
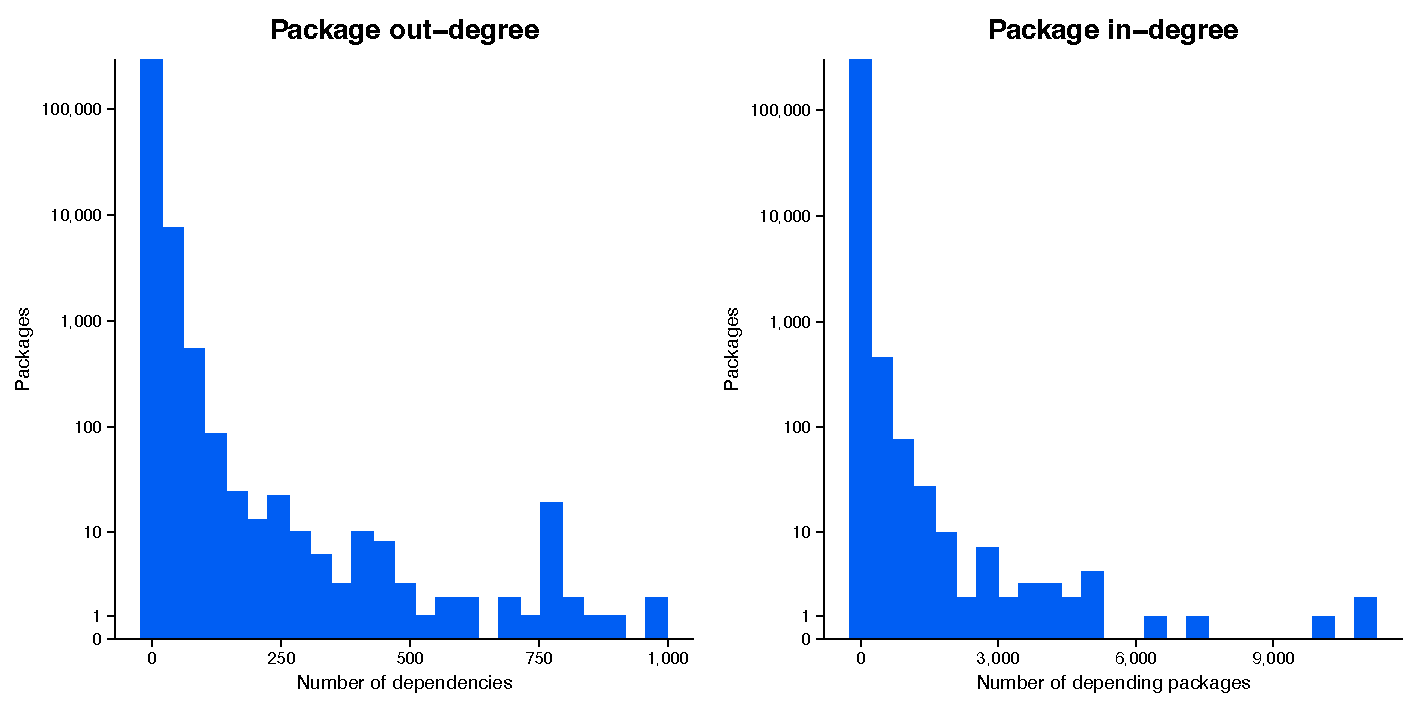
Beyond these qualitative descriptions, there is actually a telltale sign that we are writing code and making software within a complex system, and it lies in the dependency graph. If you’ll recall from the previous installment of this network-focused blog series, we’ve been analyzing the dependencies among the packages that we currently have ingested in the Phylum platform (Figure 1). Specifically, we showed that many packages have a few dependents, while a few packages have many dependents (Figure 2).
This pattern—many network nodes with few links and few with many links—is a classic pattern in the networks of complex systems. It is known as a power law distribution (Figure 3): the probability that a given node in the network will have x links is described by the formula x −k (this is called a power law in mathematics) and therefore low values of x are far more likely than high values. For example, in social networks on Twitter, many people have relatively few followers, while a few people have a huge number of followers (think influencers and celebrities).
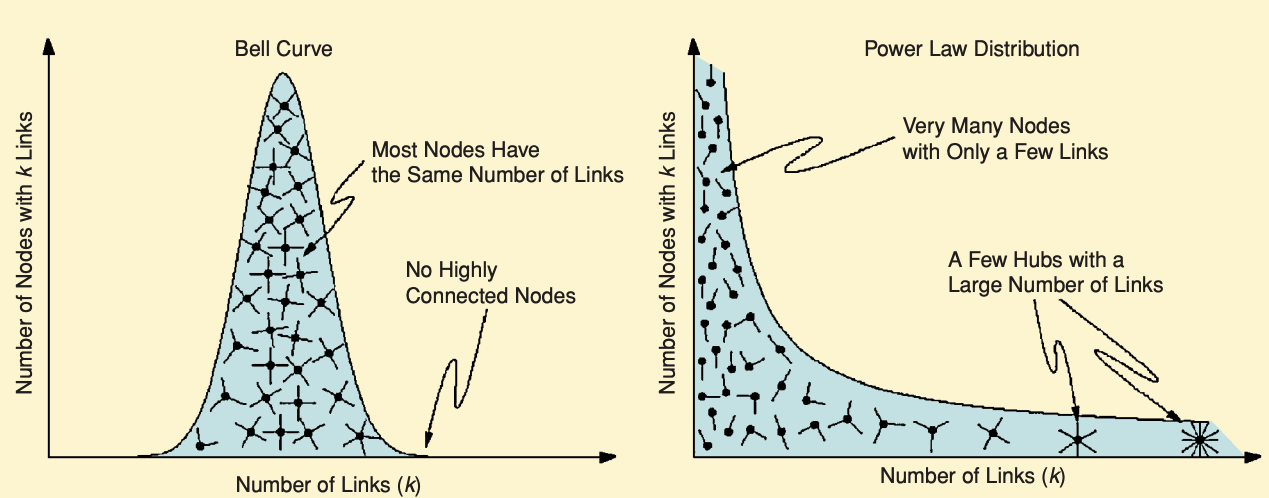
This pattern stands in contrast to other networks, where links in the network can be described by the well-known bell curve. Most nodes have a similar number of links, plus or minus a few links. For example, when we look at America’s highway network, the distribution of the number of intersecting highways at an interchange—that is, the number of links an interchange has—follows a bell curve. That makes sense, since engineers are physically limited by how many highways could possibly intersect at a given location. Moreover, highway systems are man-made systems that are designed from the top-down: civil engineers meticulously plan the entire layout to maximize efficiency and transportation goals. This stands in contrast to complex systems, which are often highly decentralized and in which the formation of links is determined entirely at a local-level, In a social network, you as an individual choose your friends; in the software ecosystem, you as a developer choose which packages you want to depend upon. Thus, bottom-up network formation like this often results in the highly uneven distribution of links.
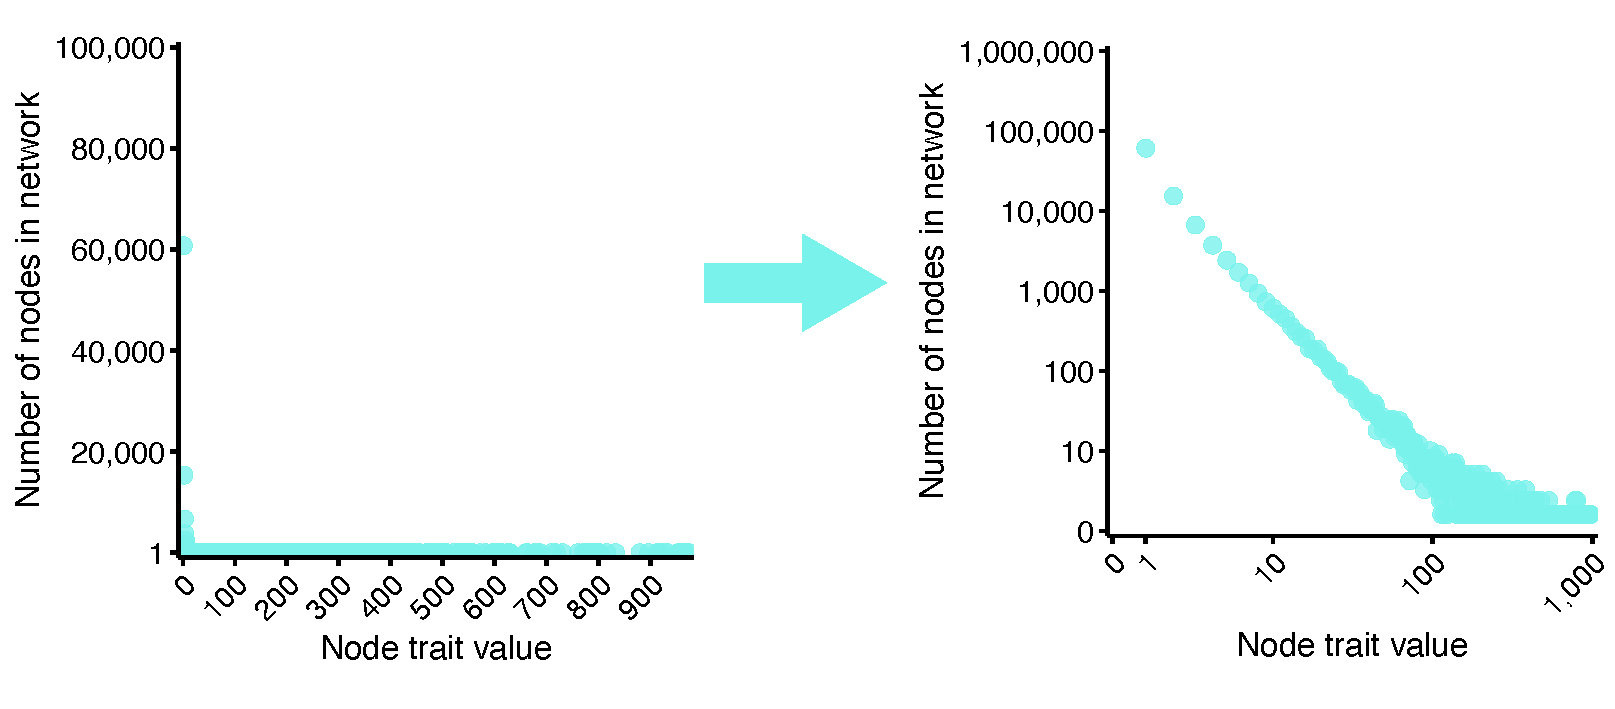
Before we jump into how the dependency network looks, I want to point out that these power law distributions have a distinct look when we visualize them (Figure 4). When we plot the distribution of node link numbers in the network, a power law distribution will look like a big inverse “L.” Importantly, when we make both axes on the logarithmic scale, the distribution will look like a straight line sloping downwards. The slope of that line describes that number k in x −k, and seeing how well a line fits is exactly how scientists tell whether a network really is following a power law. So, just remember: when you see a straight line in a plot with logarithmic scales, think “that’s a complex network.”
When we plot the distribution of links from the software dependency network, we see the distinct power law shape (Figure 5). The plot has both axes on the logarithmic scale and we see a straight line. This indicates that hundreds of thousands of packages have very few or even no packages that depend upon them, while a handful have many thousands of direct dependents.
To really drive home that this dependency network shows a classic sign of a complex network, I’ve plotted data from the dependency network alongside other networks from complex systems: the social network from Twitter and the international trade network2 from the global economy. You’ll notice that all three networks have the distinct straight-line shape that indicates a power law distribution.
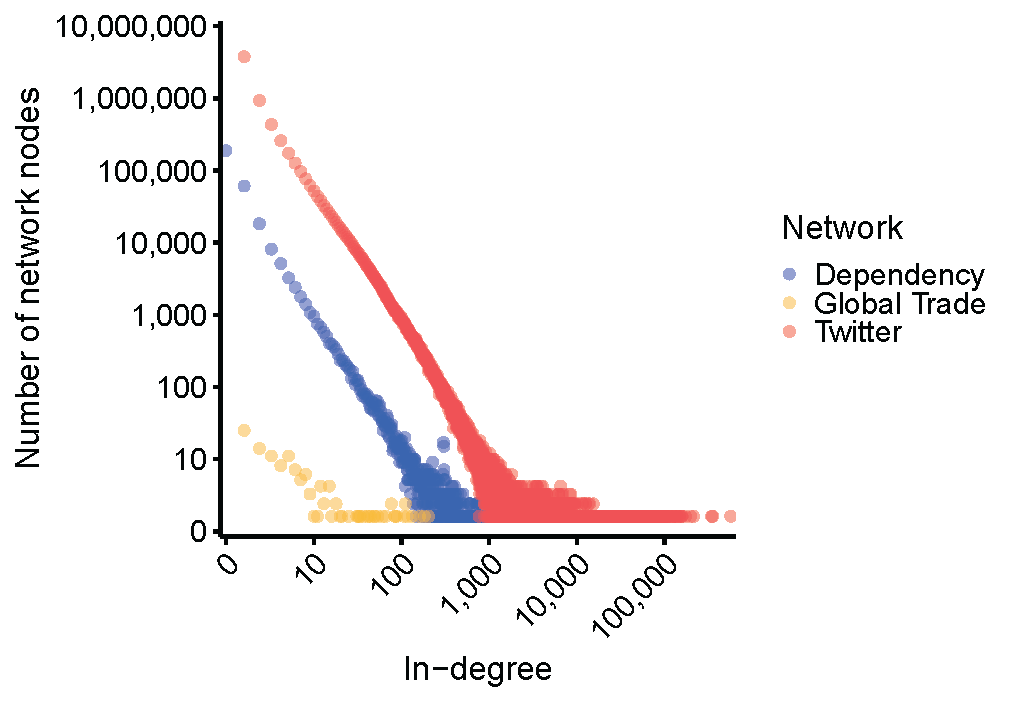
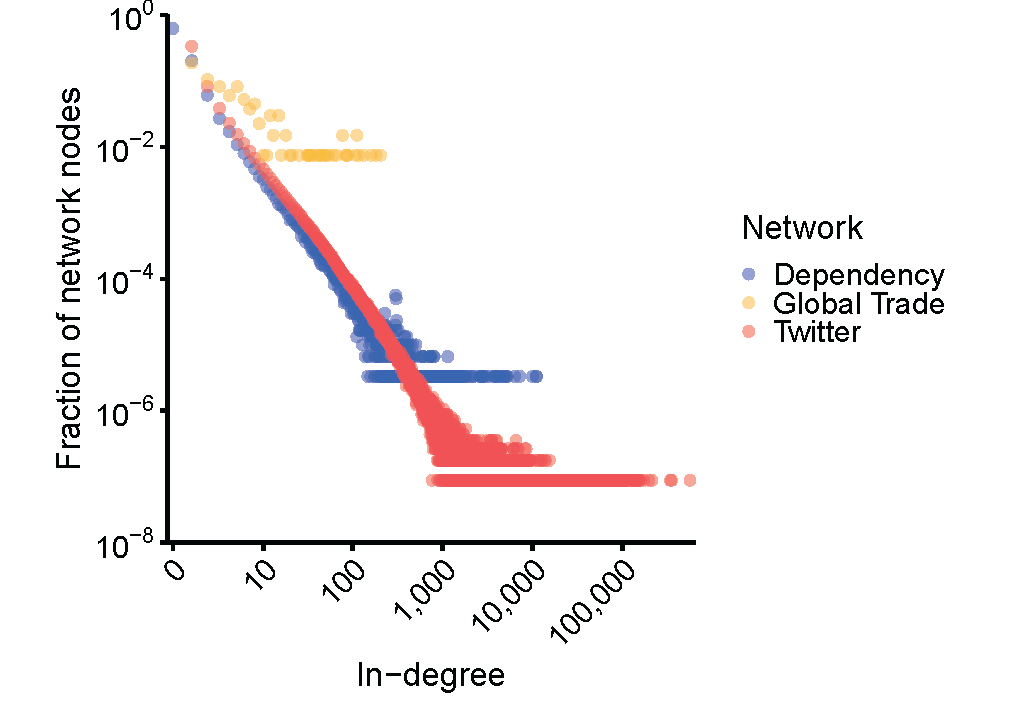
You might notice that the lines are all straight, but some are higher than others. This is because we are doing raw counts, and each network is a different size. There are only a few hundred nations in the global trade network, hundreds of thousands of packages in the software dependency network and millions of people on Twitter. So, let’s make these networks all more comparable by making it a plot of probability instead of raw counts (Figure 6): the y-axis now represents what fraction of the network is made up by nodes with N links. As you can see, the software dependency network and Twitter social network lie right on top of each other, and the global trade network trends in a similar direction (since it is a much smaller network, there is a lot more noise in the data).
So what does this mean for me and my software?
While I hope that you might be as interested in complex systems as I am, I also know that knowledge in industry is best when it is both interesting and useful. So, below are some things that complex system theory could tell us about cybersecurity.
1. See the forest from the trees: to understand risk, you need to look holistically at the software ecosystem
Because complex systems are greater than the sum of their parts, you need to worry beyond just your immediate code, and instead think about the bigger picture. For example, as we’ve previously highlighted, your code likely has far more dependencies than you realize, leaving you vulnerable to supply chain attacks. Moreover, because the open-source software ecosystem is as much a technological system as it is a social system, you also need to consider the vast web of authors, among other things.
Therefore, to stay safe in the modern open-source software ecosystem, think big. Consider a variety of indicators of risk, including indicators that there is risk to the dependencies of dependencies, even if your immediate code seems safe.
Also, consider indicators of risk that seem non-obvious or unlikely to flag most packages. Complex systems and networks exhibit tail risk — events that are highly unlikely to happen in any given moment, but can be devastating when they do. Therefore, if your security practices only focus on the kind of cybersecurity vulnerabilities that most come across 99% of the time, you’re leaving yourself exposed to the rare, but very harmful 1%. For example, if you’re not paying attention to authors, you’re extremely vulnerable to when a password breach event on some unrelated platform, like an ecommerce site, exposes the credentials of an author who does not use unique passwords across sites. An event like this isn’t going to happen very often, but when it does, a bad actor will have immense access to the author’s repos, and can therefore easily add malware undetected.
This is the exact need Phylum is attempting to fill: we cast a wide net of analytics and machine learning to find as many indicators of risk as we can — both common and rare — and we intelligently combine them into a set of easy-to-consume scores of risk across domains, including vulnerabilities, license misuse, authorship, engineering risk, and malware.
2. Stay on your toes: complex systems are constantly and unpredictably evolving
A complex system will evolve as the parts that make it up change (e.g., new software authors contributing to projects), as the system changes in size (e.g., the number of new authors and/or packages increases), and as external forces shift (e.g., changes in prevailing technology and methods). Moreover, because of all the intricate interactions in a complex system, small shifts in one of these forces can result in a disproportionate shift in the behavior of the system—thanks to what is called non-linear dynamics.
So, this is all to say that the open-source software ecosystem — and the risks inherent in it — will likely grow and shift faster than we might expect. Therefore, whatever method you are using to secure your code base, you are best served by one that can react quickly and continue to adapt along with the ecosystem. For example, a security method that only relies on verified vulnerabilities published in the CVE database will likely miss a ton of security risk, since it takes a long time for a vulnerability to be manually verified after being discovered. Alternatively, if you rely on a security product that doesn’t invest enough in adding new features and detection methods, your codebase security will probably fall behind an open-source software ecosystem changes at an increasingly fast pace.
3. Avoid becoming overdependent on certain software packages
In complex systems, it can be a bad thing to be overconnected. Think of a friend group. If your friends are all friends with each other and you all hang out often (a densely connected network), all it takes is one person to get sick for you all to get sick. It’s a domino effect. Similarly, the overconnected deposit network among banks was predicted to be a massive vulnerability for the banking system — a prescient prediction that was proven correct just a few months later in the 2008 global financial recession.
Therefore, to avoid a domino effect of security risk, don’t plug yourself into an overconnected part of the open-source software network. Do you rely largely on packages authored by the same set of authors? If so, all it would take is for one author to have their account compromised for your entire codebase to be at risk since that author’s account might have access to a vast majority of the packages you depend upon. Like investing, consider diversifying your package portfolio with a range of trustworthy authors.
Footnotes
1 Part of my PhD was focused on studying social organization in social insect colonies, like ants and bees. One of my favorite cocktail party facts is that the “queen” in a colony is a misnomer! She isn’t an authority that dictates what other workers do; workers choose their jobs democratically. Instead, the queen is best thought of as a super specialized worker whose sole job is laying eggs. Not so regal if you ask me.
2 For the trade network, we constructed the network by connecting the top 12 trade partners (in terms of amount imported) for each country.